

Audience and Prerequisites
This post is aimed at SQL Server DBAs and Data Platform Engineers who are familiar with performance tuning concepts. It makes use of the dbatools PowerShell module, which can be downloaded from: https://dbatools.io
Value-Added Performance
We regularly conduct performance reviews for our clients as a proactive, value-added service. These reviews help identify opportunities to:
- Improve performance
- Identify issues early
- Collaborate on optimisation and development concepts
- Enable faster troubleshooting
- Reduce outages
- Reduce costs
- Implement standardisation across environments
- Minimise the risk of future issues
Unlike our regularly run Best Practice Assessments, these reviews focus specifically on the areas where we most frequently see performance challenges. They are designed to provide actionable recommendations and deeper insight into system behaviour.
The approach we take here can be adopted by SQL Server DBAs and Data Platform Engineers looking for rapid insights and standardised repeatable performance reviews.
Standardising the approach
No doubt you will have your own ideas on what should be included in a performance review, and even how they should be conducted. With environmental knowledge, performance reviews can be fine-tuned and made specific to targets or needs. This is also how we tune and tweak our reviews, as time progresses, but initially we hit the ground running using a standardised approach.
Glenn Berry’s SQL Server Diagnostic Queries
If you’ve read my blog on ‘Christmas Gifts! Free tools to help you and SQL Server get on better in 2026’ you’ll be aware of just how much I personally make use of these and what an advocate I am for them. When it comes to standardising a Performance Review, these jump right out as a great starting place; so that’s what we’ve done. There is no installation necessary, and each script can be run against your choice of targets to obtain sufficient performance information to get started.
Dbatools.io
The dbatools module is another tool set I’ve mentioned before, it’s a wonderful free PowerShell module to help with DBA tasks. It has such a range of uses and one such use is its ability to run Glenn’s Diagnostic Queries using the function Invoke-DbaDiagnosticQuery.
Invoke-DbaDiagnosticQuery
The function was written by the fantastic André Kamman who is a major contributor to the dbatools project. Rather than me explain the function here, I’ll put a link at the end so you can read his T-SQL Tuesday blog on it. If you wish to see the source code visit the git repo.
Configuration
Using an instances list and queries list ensures any configuration is easily transferable to different client environments. The function has options to help configure per execution but to fully automate using the two CSVs is great.
Execution
Executing the queries by way of the Invoke-DbaDiagnosticQuery function is simple; the version is set for you, rather than having to select and pick the correct script for the target SQL version. The configured list of instances ensures all specified queries are executed and the results are returned consistently across environments.
There is an additional function that we also make use of: Export-DbaDiagnosticQuery. As you’d guess, this exports the results to file; the example later shows how this is used.
Please Note:
The SQL Server Diagnostic Queries mentioned here generally execute against all databases and, when capturing top queries, the top 50 are collected. This could result in quite a bit of data to work through, so you may wish to tweak the underlying SQL scripts and change the top statements to something like 5 or 10.
It’s possible to restrict the results client side with the use of a PSObject on the results and filtering there but it’s going to be less costly to filter as early as possible.
Example executions
To obtain a reasonable overview, and depending on any existing monitoring insights, I start with a standard query set stored in the Queries.csv file:
Configuration Values
Global Trace Flags
Process Memory
SQL Server NUMA Info
System Memory
Database Filenames and Paths
Drive Level Latency
IO Latency by File
IO Warnings
Database Properties
Missing Indexes All Databases
VLF Counts
CPU Usage by Database
IO Usage By Database
Total Buffer Usage by Database
Top Waits
Top Worker Time Queries
PLE by NUMA Node
Memory Clerk Usage
Ad hoc Queries
Top Logical Reads Queries
The command snippet used to run the queries against the target instances is below, this also exports the results (full code later):
Invoke-DbaDiagnosticQuery -SqlInstance $I -QueryName $Queries.Query  |

Export-DbaDiagnosticQuery -Path "$PSScriptRoot\DiagnosticResults\$I"
The Invoke-DbaDiagnosticQuery function is executed within a loop to ensure all instances are hit and, if necessary, additional filter and sort aspects can be used without needing to change the wrapper too much.
Setup
A wrapper script is used to pull in the instance names and queries; this also executes the Invoke-DbaDiagnosticQuery.ps1 script. Each of the csv files should have the relevant headers of Instance and Query.
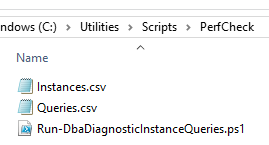
I have a couple of variations on the same theme, one limits database by size, the other by CPU usage, but the wrapper allows any additional queries to be run and used to help control the execution; we’ll cover these more in a future post.
This post uses the basic wrapper, which does not apply any database-level filtering:
# Resolve ScriptRoot (works in ISE F8/F5, console, schedulers)

if (-not $PSScriptRoot) {

$ScriptRoot = Split-Path -Parent $MyInvocation.MyCommand.Definition

if (-not $ScriptRoot) {

$ScriptRoot = $PWD

}

} else {

$ScriptRoot = $PSScriptRoot

}

# Set base output folder and timestamp

$BaseOutPath = Join-Path $ScriptRoot 'DiagnosticResults'

$dt = Get-Date -Format "yyyyMMdd_HHmm"

# Ensure base output folder exists

if (-not (Test-Path $BaseOutPath)) {

New-Item -ItemType Directory -Path $BaseOutPath -Force | Out-Null

}

# Trust server certs

Set-DbatoolsConfig -FullName sql.connection.trustcert -Value $true

# Import Instances to target

$Instances = Import-Csv (Join-Path $ScriptRoot 'Instances.csv') -Header "instance"

# Import queries to run

$Queries = Import-Csv (Join-Path $ScriptRoot 'Queries.csv') -Header "Query"

ForEach ($row in $Instances) {

$instance = $row.instance

# Sanitize for file paths

$safeName = $instance -replace '[\\/:*?"<>|]', '_'

# Build instance-specific output folder

$outPath = Join-Path $BaseOutPath $safeName

if (-not (Test-Path $outPath)) {

New-Item -ItemType Directory -Path $outPath -Force | Out-Null

}

Invoke-DbaDiagnosticQuery -SqlInstance $instance -QueryName $Queries.Query |

Export-DbaDiagnosticQuery -Path $outPath

}

# Zip results

$Files = Get-ChildItem $BaseOutPath -Exclude *.zip -Recurse -File

$Files | Compress-Archive -DestinationPath "$BaseOutPath\$dt.zip"

$Files | Remove-Item -Recurse
As the script is executed the PowerShell window displays progress as shown:
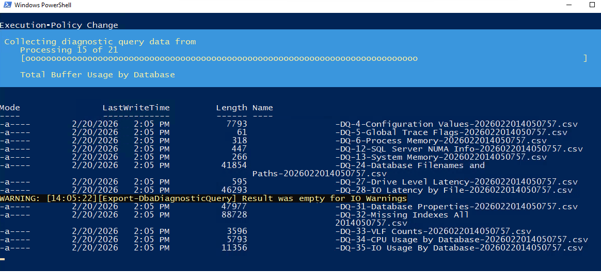
An additional folder is created for the overall results, and sub folders are created for each instance. Within those folders will be the results as they are obtained:
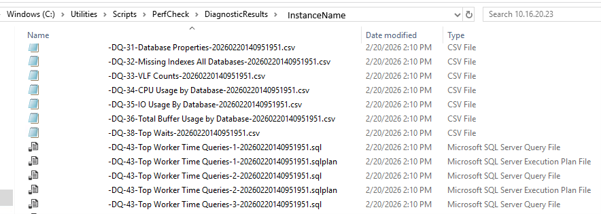
Once all the results have been received, the script then zips up the complete set and removes all the original files.
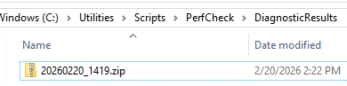
The zip can be used or analysed as needed; keep in mind that the data could be sensitive with stored parameter values so whether the zip file is moved will be down to compliance considerations.
Note: this is a basic version of the script to help get you started. It assumes windows credentials are accepted and access to the targets does not need to be tested first. In future posts this will be built on.
Get started
- Define Instances.csv and Queries.csv
- Run the wrapper script
- Review instance metrics
- Review summary CSVs
- Prioritise CPU, IO, and wait-based findings
Analysis
Although an in-depth analysis is beyond the scope of this post, a structured approach could be:
- Review instance-level metrics (CPU, memory, waits)
- Focus on known or suspected pressure areas:
- CPU (Top Worker Time Queries)
- IO (IO latency and usage queries)
- Use summary CSVs to quickly identify high-impact queries
- Drill into execution plans and query details where needed
When analysing, the aim is to ensure a few high-value, low-impact, tuning options are found. Be sure to investigate everything further and validate any suggestions e.g. index recommendations require a review of the entire table, to understand access patterns and existing indexes; execution plans may also need to be reviewed. There are many other areas to consider but hopefully these steps will provide a nice starting point.
If there are no performance issues at present, this process provides you with a baseline to refer back to if there are future performance issues; run the script again and compare the output CSVs to this baseline to help target your tuning efforts.
We’ll cover a real-world tuning example in a future post in this series.
Summary
This approach enables a high quality, rapid, consistent and repeatable, performance review across multiple SQL Server instances by use of the dbatools PowerShell module and Glenn Berry’s SQL Server Diagnostic Queries.
If you’d like help in setting up something within your estate or assistance in analysing any performance issues, Coeo has a proven track record of helping clients implement and benefit from approaches like this.
Further Reading
Christmas Gifts! Free tools to help you and SQL Server get on better in 2026
Invoke-DbaDiagnosticQuery – André Kamman
Invoke-DbaDiagnosticQuery
Export-DbaDiagnosticQuery
Get-DbaRegServer
Resources – Glenn’s SQL Server Performance