

Introduction
I do not know about you DBA’s and Developers, but who here breaks out in a sweat when it comes to looking at Execution Plans (EP)? Just me?
I thought to myself that after so long working with SQL Server that it was time to break this curse and get a better understanding of them and, more importantly, how to read them properly.
What is an Execution Plan?
The best way to look at them, is as a road map for the query you are trying to run to get the best possible result. Much like when you are taking a trip somewhere, there can be multiple ways to get to your target. However, in most cases you would want the best possible route to your destination. This is what the EP is there to do. However, without say the correct index in place, your query is going to struggle to find the best route to your data and this can then lead to what is known as a Bad Plan. As we have all no doubt found out with many a trip, the shortest route is not always the quickest.
Initial Investigation Steps
How do I get to see the EPs? Well, there are 3 ways to view an execution plan and yes, I mean 3 not 2.
Firstly, there is Estimated Execution Plan. Think of this as when you are planning a journey with say Google Maps (Other Mapping tools are available) you will have projected route and estimated arrival time based on previous Journeys (statistics). Diagram 1.1 Red Box Below
Secondly, there is the Actual Execution Plan. Which is in effect the same as an estimated plan but with runtime statistics included and is shown on completion of the query. This will be the actual route and time taken to get to your destination. Just think how often you have been on a journey, and your Satnav has rerouted you. This may well happen to your query i.e. a better route is found. Diagram 1.1 Green Box Below
Thirdly, and the newest on the block, is the Include Live Query Statistics, this was introduced from SQL 2016. This returns a copy of the execution plan which is updated in real-time as the query is running. Imagine this as you looking at your Satnav and checking your current progress, what it has cost you in terms of time so far and an estimated arrival time. Diagram 1.1 Yellow Box Below
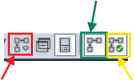
Diagram 1.1
Most of the time each of the 3 Plan types above will be very similar if not identical once completed. However, they can differ wildly at times if your statistics are out of date. Which is why good Index and statistics maintenance is important.
Let’s have a quick look at a basic EP below (names scrubbed out to protect the innocent/customer). It might depend on who you listen too, but it can be easier to read an Execution Plan from Right to Left and then Top to Bottom.
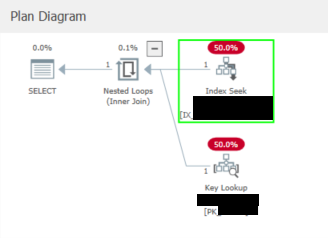
Diagram 1.2
We can see here the Flow of the Data is coming from the Non-Clustered and Clustered Indexes nodes in the example above, flowing back to the Select to return the data.
But what are these nodes doing and how can we find out more information? Well, you can click on these nodes and see the related properties window (as shown to the right on the image below of an estimated plan). This is a much easier way to see what is going on within the object, than trying to hover over it (as I often used to do) to find out the values. This example highlights an index seek, with its related properties window.
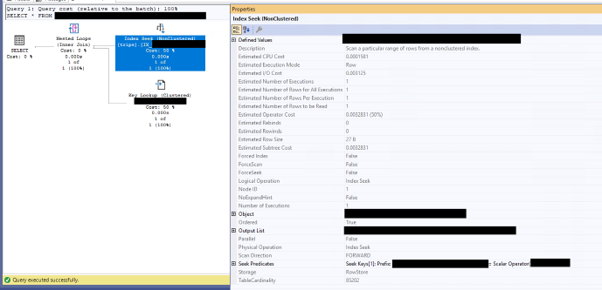
Diagram 1.3
From the properties window there is actually lots more information than can be seen from just hovering over the object alone. Indeed there is more than is even shown above, as there are further node points that can be expanded i.e. actual rows returned, statistics etc. However, just looking above we can see how many executions the query has had and estimated operator costs (which is the DB Engine Optimiser best guess at how costly the query is). Also, I/O costs, which highlights the queries estimated cost to get the information from the disk.
Other important things to look out for is the estimated number of rows returned. In some cases the actual number of Rows Read can be far higher than what you are returning and can be a costly operation. This highlights an area that could be looked at. For instance, could it be improved with either an index or just making sure your query is tuned properly.
In short looking at objects via the properties window, can be much easier than hovering over the object to try and find out the information.
Remember when looking at EP’s, make sure you look for low hanging fruit first. If there is a node/object that is in RED and say using 70-80+% of the Plan value, then this a good place to start.
Is there Another Way?
SQL Server Management Studio (SSMS) may not always the best tool to use when reading an EP. Sure, we all start there, but is it is best and easiest way to read the plan? There is a great tool that I use called SQL Server Plan Explorer (SSPE). I often use it to view EP’s, as I find it much easier to read them using this tool, especially for larger plans. All you need to do, is just get the XML for the Plan from SSMS and load it into the tool. This is done within SSMS by hovering over the plan in question and right clicking on it and select ‘Show Execution Plan XML….’., this will open a fresh window, and the resulting XML can then be copied into a new plan window in SSPE.
Using SSPE you can view lots of information that cannot be easily seen in SSMS. Let’s have a look at a Query run against the good old AdventureWorks Database. The query I am running is fairly simple SELECT Statement with 2 further joins as per below.
SELECT e.BusinessEntityID, e.JobTitle, d.Name AS DepartmentName
FROM HumanResources.Employee AS e
JOIN HumanResources.EmployeeDepartmentHistory AS edh
ON e.BusinessEntityID = edh.BusinessEntityID
JOIN HumanResources.Department AS d
ON edh.DepartmentID = d.DepartmentID
WHERE e.JobTitle IN (‘Sales Representative’, ‘Marketing Manager’)
Looking at the above query as copied across to SSPE, we can see the following including the plan diagram. I have however also highlighted other areas we can look at such as Top Operations at the bottom of the image.
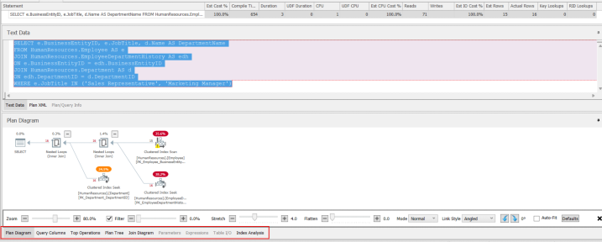
Diagram 2.1
So let’s have look at Top Operations within the query and below we can see 2 clustered Index Seeks and a Scan with their associated costs including I/O and CPU. Could there be an opportunity for tuning here?

Diagram 2.2
For this Select statement, we know that there are two joins, but what does this look like graphically? Well this is shown in the Join Diagram 2.3 below.
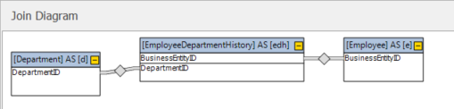
Diagram 2.3
At the bottom of the 1st diagram in this section (Diagram 2.1) above, we can also see highlighted Query Columns, Plan Tree and Index Analysis, where we can find further information on the query and its associated objects. If the query had any parameters or Expressions then these will also be shown. These can be very helpful when investigating any performance issues in your queries.
There is some further information about SSPE in my colleague Martyn Jones Blog where he also talks about other handy tools that can be used in conjunction with SQL Server – Free SQL Server Tools & Tips for 2026 – COEO and the SSPE tool itself can be downloaded from Plan Explorer – SQL Query Analysis | SolarWinds.
Comparing Plans
Is there anything else we can use in SSMS? Yes is the answer! There is a helpful feature called Compare ShowPlan, which can aid you in seeing the differences between the 2 EP’s. You just need to save one of the EP’s, then you compare by right clicking in the 2nd of the two plans that you want to compare and then select Compare ShowPlan and import the plan you have saved, you can then view the differences as per below. This is very handy when you want to compare a before and after situation e.g. when adding an index, this can highlight the improvements.
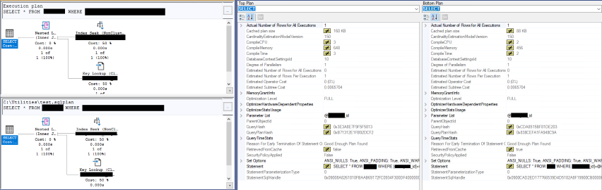
Diagram 3.1
Further Reading
Homework Time 😉 If you want to know more about EP’s, there is a great free eBook by Grant Fritchey. What he doesn’t know about them probably isn’t worth knowing. This can be found at the following address – https://www.red-gate.com/products/redgate-monitor/entrypage/execution-plans/. In this E-Book, Grant will go from an Introduction to Execution Plans -> Parallelism -> Talking about the Query Store, which is another really useful Tool, which was released back in SQL Server 2016, to monitor query performance metrics at the database level.
Another really useful information source is a series of YouTube Videos by Bert Wagner titled SQL Server Execution Plans. It is a 5 part series of videos, which are all around 10-15 minutes each and give a really good grounding in EP’s and how to get the most out of them. Here is a link to his channel – https://www.youtube.com/@DataWithBert.
To go alongside this blog, my colleague here at Coeo Matt Maddocks, has recently written a brilliant blog post that gives an introduction into Indexing in SQL Server (SQL Server Indexing 101: Why Everything Feels So Slow – Coeo) and this can used in conjunction with this post.
Conclusion
Hopefully this Blog will help you in your day to day use of EP’s, and show you they are not as scary as they initially look. Also remember there are tools out there like SSPE which can make them easier to view, especially when looking at larger EP’s. As the great Philosopher Yoda once said, Do or Do Not There is No Try…..